By the end of the subtopic, learners should be able to:
List elements of weather.
State and describe instruments used to measure each element of weather.
Describe how data about elements of weather is recorded.
Calculate averages from recorded data about weather elements.
Definition of Weather
Weather is described as the average daily condition of the atmosphere at a given place.
It is the degree of hotness or coldness, wetness or dryness, calmness or storminess, clearness or cloudiness in the atmosphere.
Elements Of Weather
These are the variable conditions of the atmosphere that are measurable.
The elements are temperature, rainfall, atmospheric pressure, wind speed, wind direction, cloud cover, humidity, and sunshine.
Temperature
Temperature is the degree of hotness or coldness.
The major source of heat is the sun.
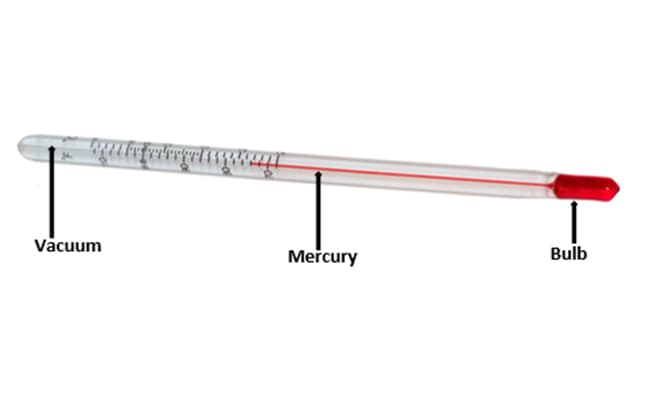
Temperature is measured by an instrument called a thermometer.
A simple thermometer is a tube that contains a liquid that expands when it is hot and contracts when it is cold.
Atmospheric temperature is measured using a Six's Thermometer.
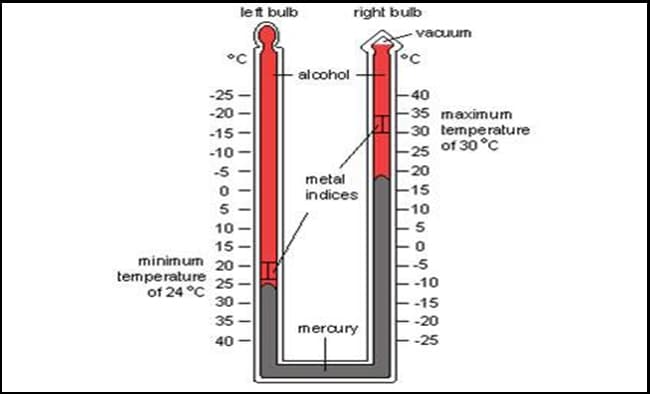
A Six's Thermometer has maximum and minimum thermometers.
Maximum thermometer measures maximum temperature while a minimum thermometer measures minimum temperature.
The maximum and minimum thermometers are combined on a Six's Thermometer.
The Six's Thermometer contains two liquids, mercury and alcohol.
How The Six's Thermometer Works
When the temperature increases alcohol in the left bulb expands and pushes the mercury in the U shaped bend towards the right tube where there is vacuum bulb.
The vacuum bulb's purpose is to allow mercury to be pushed towards it when alcohol expands in the right tube.
The index (which functions as an indicator) is pushed by the mercury up to the point where the highest recording for that day is taken. When the temperature falls the mercury contracts back in the bulb leaving the index up and that will be highest temperature reading.
Alcohol in this case is the one expanding and contracting to measure temperature.
The purpose of mercury is to push the indicator.
When it gets cold alcohol in the left tube contracts and thus allows mercury to move up the left tube as it follows the contracting alcohol.
In the process the mercury liquid pushes up the metal index in the left tube to record minimum temperature.
Alcohol flows through the metal index and so when temperature rises again it is left reading minimum temperature.
Temperature readings are done at 08:00hrs in the morning of the next day.
This time is good because maximum temperatures are reached during the afternoon while minimum temperatures are reached just before dawn.
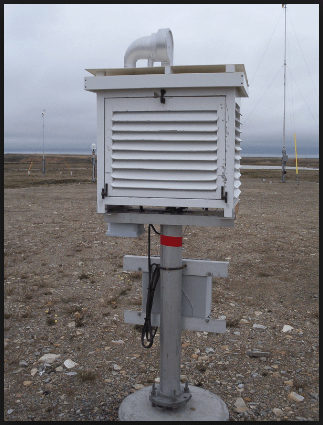
The Six's Thermometer is kept in a Stevenson Screen.
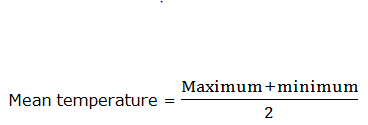
Average Temperatures
1. Mean Daily Temperature
It is calculated using the following formula
2. Mean Monthly Temperature
This is calculated by adding all mean daily temperatures for the month and dividing by the number of days in the month.
3. Mean Annual Temperature
We add mean monthly temperatures and divide by twelve months of the year
4. Daily or Diurnal Temperature Range
It is the difference between maximum and minimum temperatures of the day.
i.e. maximum - minimum = daily temperature range
5. Monthly Temperature Range
It is the highest mean daily temperature minus the lowest mean daily temperature
6. Annual Temperature Range
We get by obtaining the month with the highest mean monthly temperature and subtracting the lowest mean monthly temperature.
Some of the above calculations are summarised in the examples contained in the table below.
DAY
MAXIMUM TEMPERATURE, ℃
MINIMUM TEMPERATURE, ℃
TEMPERATURE RANGE, ℃
MEAN TEMPERATURE, ℃
1
32
16
32 - 16 = 16
2
29
12
29 -12 = 17
3
31
8
31 - 8 = 23
4
27
10
27 - 10 = 17
Stevenson Screen
This is a white box with louvred sides as is shown in the picture below.
It houses Six' Thermometer and hygrometer.
It is painted white so that it does not absorb heat.
It has louvred sides to allow free movement of air.
It is made of wood because wood does not absorb heat or cold as much as metal or other substances.
It is pitched above the ground ( up to about 1.5 metres) in tropical regions in order to avoid ground heat.
Atmospheric Pressure
Atmospheric pressure is the weight exerted by air in the atmosphere on the earth's surface.
Atmospheric pressure is heavily influenced by altitude and temperature.
When air is heated it expands and hence it becomes lighter.
There is less air in high altitudes areas hence less pressure.
Pressure is measured in millibars by an instrument called a barometer.
There are two types of barometers, Mercury and Aneroid.
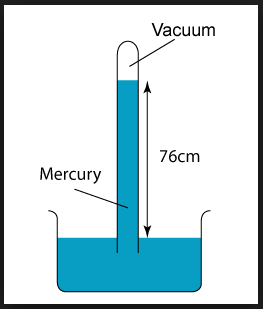
Mercury Barometer
Atmospheric pressure is highest at sea level.
At sea level the mercury column in the Mercury barometer (shown above) rises to 76 cm.
As one moves upland from sea level pressure falls and so does the column level decrease.
The height in millimeters of the column of mercury is compared on a scale to find pressure reading, e.g. 76cm =760mm= 1013.22 millibars. That is pressure at sea level.
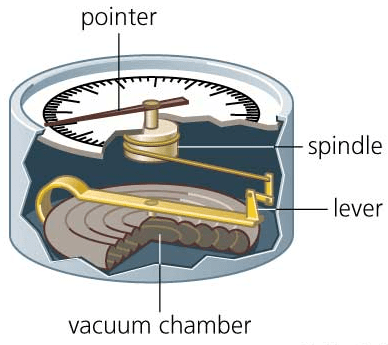
Aneroid Barometer
The Aneroid barometer is easier to use because the pointer simply indicates atmospheric pressure reading.
Inside it the barometer, there is an aluminium plating which has a vacuum chamber and this plating collapses inwards and moves the lever and spindle when pressure increases.It releases when pressure decreases thus moving back the lever, spindle and pointer.
Lines joining places with equal pressure on a map are called isobars.
Wind
Wind is air in motion.
Wind has direction and speed.
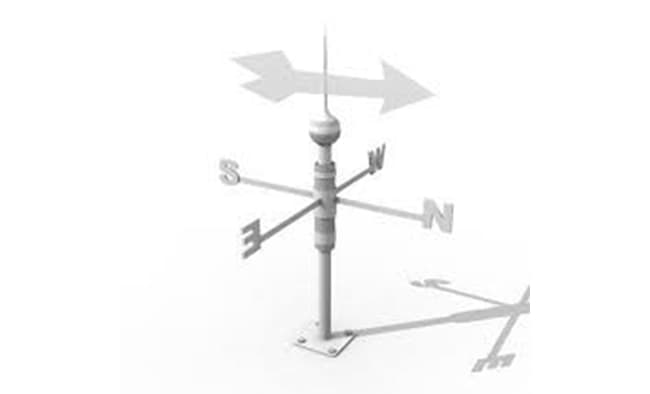
The direction of wind is measured by an instrument called a wind vane.
The wind vane, which is shown in the picture below, is an instrument with a pointer that sits on top of an axis of cardinal points.
As the wind blows the pointer points in the direction from which the wind is blowing and that gives wind direction.
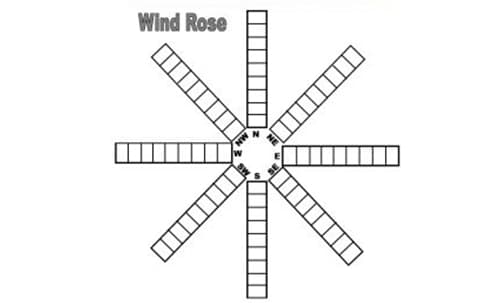
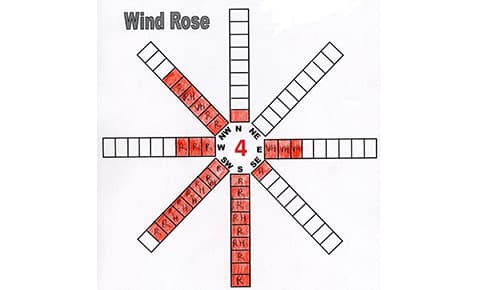
The daily wind direction is recorded on a wind rose (see diagrams of wind roses below).
The boxes are marked according to the number of days the wind blew from that direction.
The number of calm days is written on the centre of the wind rose.
The wind rose above has the following data of the month.
There were 4 calm days recorded.
1 day of South Easterly wind.
9 days of Southerly wind.
8 days South westerly wind.
3 days Westerly wind.
6 days North Westerly wind.
3 days Easterly wind.
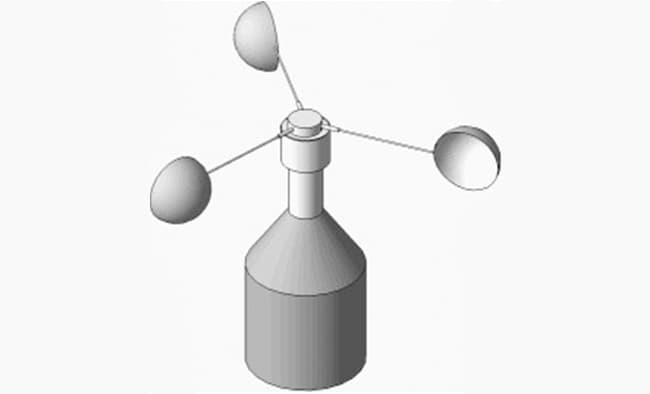
Wind Speed
Wind speed is measured in knots by an instrument called a cup anemometer (pictured below).
It is made up of rotating cups who's turning is recorded on a speedometer.
Humidity
Humidity is the amount of water vapour in the atmosphere.
Relative humidity is the amount of moisture in the air compared to the maximum amount that the air can hold at that temperature.
It is, therefore, expressed as a percentage.
The water vapour in the air comes mainly from evaporation. Air is said to be saturated when it holds the maximum amount of water it can at a particular temperature.
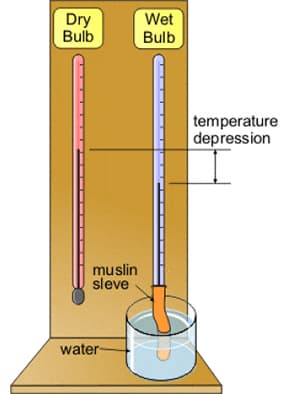
Humidity is measured by an instrument called a hygrometer, also known as a wet and bulb thermometer (see diagram below).
When the air is dry the muslin cloth/sleeve will soak water from the container, becomes wet and will cool the bulb.
The other thermometer which has no muslin cloth records the atmospheric temperature as it is without any cooling effect.
The difference between the two temperature readings shows how humid the atmosphere is.
When there is no difference in the temperatures of the two thermometers it means the air is saturated.
Relative humidity will thus be 100%.
A small difference implies that humidity is very high and the air is moist.
A large difference indicates that the air is dry and humidity is very low.
Clouds
Clouds are formed when the water vapour in the air turns into water droplets through the process called condensation.
Clouds can easily be seen and people can tell whether it will rain or not.
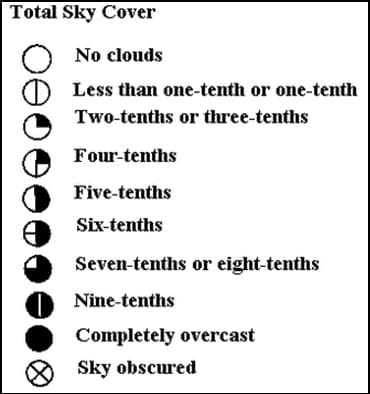
The amount of cloud cover in the sky is measured as a fraction of an eighth .
Each eighth is an okta
Measurement of cloud cover is done by observation; simply looking into the sky and estimating the cloud cover.
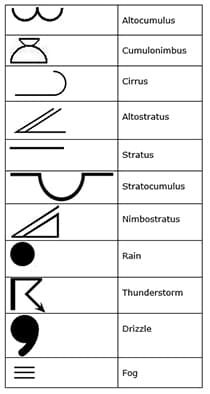
The chart below shows symbols of cloud cover.
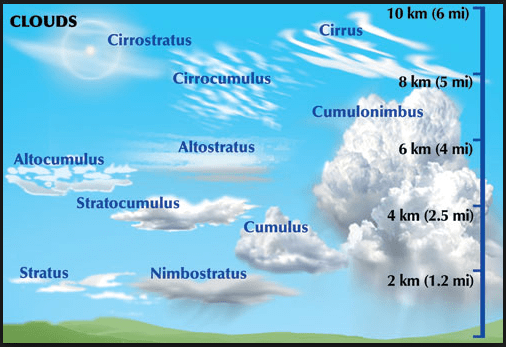
Types Of Clouds
Clouds are classified according to altitude and appearance.
Types Of Clouds
High Level Clouds (Above 7 km) - Cirro
1. Cirrocumulus
Resemble ripples like what waves leave on sand.
Composed of ice crystals.
2. Cirrostratus
Thin veil of ice crystals.
A milky and white which is almost transparent to the sun.
3. Cirrus
High and wispy
Made up of ice crystals which are white and crispy.
Middle Level Clouds (2 km — 7 km) - Alto
4. Altocumulus
It is made of water droplets which are bumpy looking.
Appears like neat rolls or long bands.
5. Altostratus
Thin grey or blue sheet.
May partly or totally cover the sky.
Is known as "guti" in Shona and is associated with continuous rain, "mubvumbi."
Lower Level Clouds (0 — 2 km)
6. Nimbostratus
A dense gray layer that covers the sky.
It may block the sunlight.
'Nimbus' means rain and so it is associated with rain.
7. Stratus
A flat layer of cloud.
It's a fog-like low cloud.
8. Stratocumulus
Sheet of parallel rolls with flat bottom.
It is soft and grey in shape which looks like sausages.
9. Cumulus
Puffy pile of cloud.
Cumulonimbus
This is a rain bearing cloud which stretches from the lower level to the high level.
It has an anvil head on its top.
It is associated with lightning and thunder; with afternoon thunderstorms after a hot day.
It is the cloud that is associated with convectional type of rainfall.
Rainfall
When the moisture in the air cools, it condenses and forms clouds.
The clouds grow until raindrops become heavy and fall down to the ground as rainfall.
Rainfall is the most common form of precipitation.
Other forms of precipitation are hail, sleet, snow e.t.c.
Types Of Rainfall
Rainfall is classified according the way it forms and there are three types.
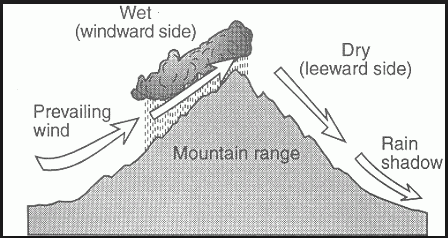
Relief or Orographic Rainfall
The prevailing winds forces the warm moist air to rise over mountains and highlands.
As the air rises it cools and condenses into tiny water droplets that we see as clouds.
The rain droplets eventually grow by colliding and sticking together until they are too heavy to remain floating.
They then fall down as rain.
The rain falls on the windward side as shown by the diagram below.
After emptying moisture the air descends on the leeward side as a cool dry wind.
The leeward side is known as the rain shadow region and it has frequent droughts.
In Zimbabwe the windward areas are Eastern Highlands and the highveld around Harare.
Rainshadow areas are Save, Masvingo, and Matabeleland.
Relief Rainfall
Relief rainfall
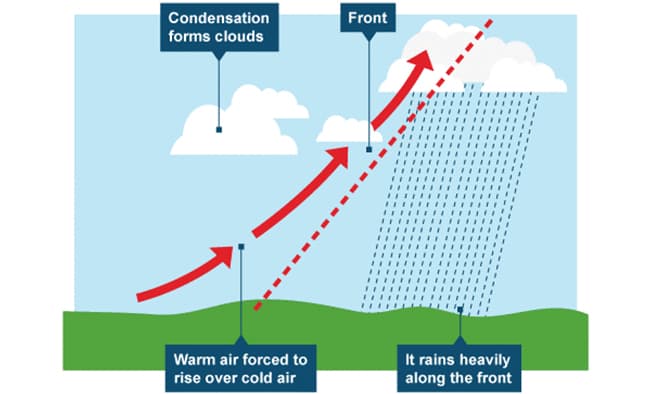
Frontal Rainfall
It is also known as cyclonic rainfall.
When the two airs meet, warm air and cold air, an imaginary line called the front is formed (see diagram above).
The warm air rises above the cold air because it is lighter.
When the warm air rises it expands, cools and condenses.
The rainfall is usually light and it falls for a very long time in the form drizzle.
Rainfall is associated with the altostratus cloud.
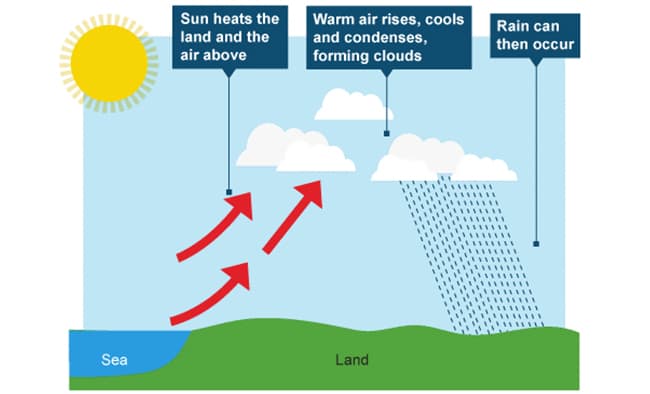
Convectional Rainfall
The sun heats up the earth's surface and the air on the surface becomes warm, expands and rises.
That air is cooled and it condenses to form clouds.
Usually, this type of rainfall is associated with the cumulonimbus clouds.
The rainfall is usually heavy thunderstorms accompanied by lightning and strong winds.
The rain usually falls in the afternoon.
Convectional Rainfall
Measuring Rainfall
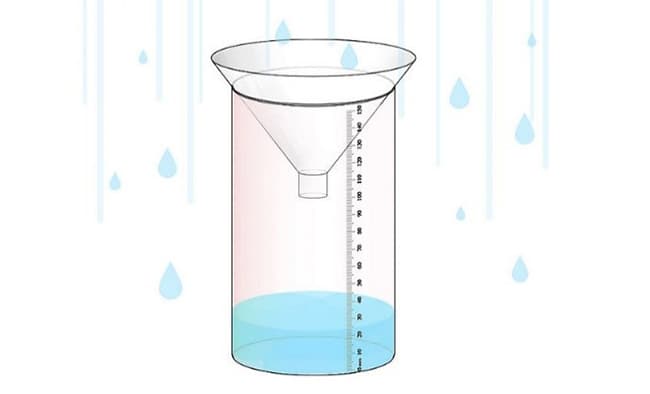
Rainfall is measured in millimetres by an instrument called a rain gauge.
The rain gauge is made of copper to prevent corrosion.
The rain gauge should be located far from buildings and trees and it should set up 30cm above the ground to avoid water from splashing in.
On a map lines joining places of the same rainfall amount are called isohyets.
Rainguage
Sunshine
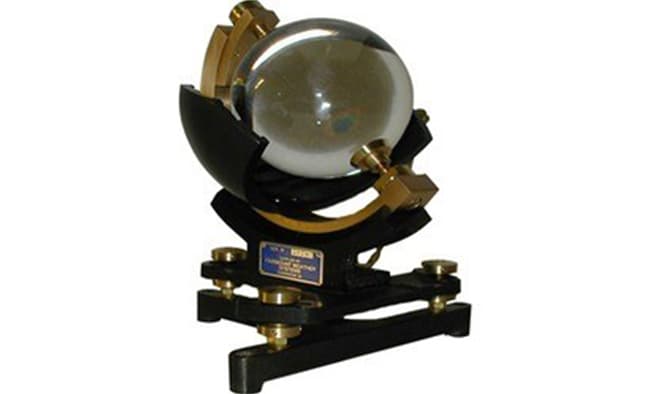
Sunshine is recorded by a sunshine recorder.
It measures the number of hours and minutes we have received sunshine in a day.
Sunshine is measured in hours.
Places with equal sunshine are joined by lines on a map called isohels.
Other Synoptic Codes
These are symbols used to show weather elements on maps.
Weather Station
A school weather station must be carefully sited away from buildings and trees in order to avoid interference with recordings of instruments such as wind vanes, rainguages and so on.
The ground upon which a weather station is built must be flat or even.
It should not be too far away so that instruments are secure.
A weather station should have instruments such as Stevenson Screen which should have Six's Thermometer and hygrometer, barometer, rain gauge, wind vane and cup anemometer.
Weather Hazards
These are sudden but severe or harsh weather conditions that cause or threaten loss of life of humans and animals or destruction of property.
Some common weather hazards are floods, droughts, storms, lightning strikes, hail storms, heat waves and blizzards.
Floods
These happen once in a while due to incessant rains or effects of dam construction.
In 2014 there were floods in Masvingo owing to the construction of Tokwe-Mukosi dam.
Again in 2017 too much rainfall resulted in floods in many areas such as Mukumbura and Tsholotsho.
Floods can be made less severe by weather forecasting which warns people of their occurrence so that they stay on high ground.
Resettlement of people to high ground also lessens the impact of floods.
Droughts
Inadequate rainfall in a season causes drought.
The effects of drought are water and food shortages.
The effect of droughts can be lessened by constructing dams to store water, growing drought resistant crops, providing food relief to affected areas, predicting droughts so that people prepare before they happen e.t.c.
Hail storms
Mixture of heavy rain and lumps of ice are what is known as hail.
Hail usually destroys crops and property and in rare cases it can result in the death of people and livestock.
To avoid effects of hail people and property must seek strong shelter when hail is about to be experienced.
Farmers need to insure crops against hail storms so that they do not suffer heavy losses.
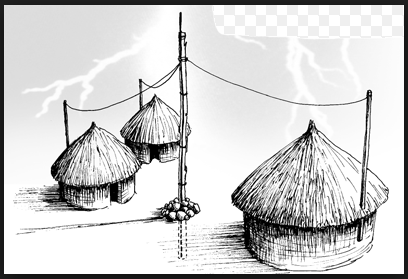
Lightning
Lightning causes loss of human and animal life each rain season.
Early warning through weather forecast can help people deal with lightning better.
People need to avoid sheltering under trees during thunderstorms.
Houses, especially huts, need to be protected from lightning strikes using pole and wire.